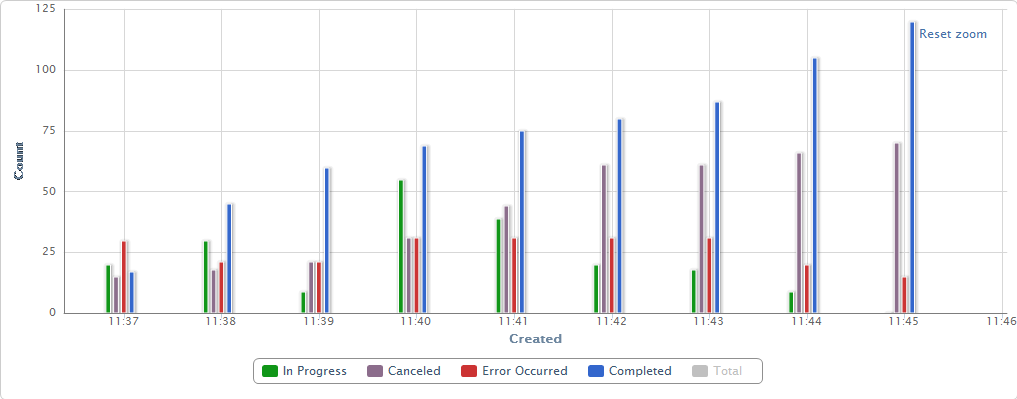
Starting with 2.0 version you can use Virto Workflow Status Monitor can together with Virto jQuery Charts and adjust graph view of workflows started in the list, on the current site or site collection.
You can define reporting settings in Virto Workflow Status Monitor that will be stored in Virto Workflow Monitor Report List.
This list stores data concerning amount of workflows in Canceled, In Progress, Error Occurred, Completed
statuses for a predefined period of time. The column Total stores number of all workflows.
There are 4 views in the list: Today, Last 3 days, Last 7 days, Last month, that allow users to filter data by different periods of time they were created.
Data from report list can be presented in graph view with help of Virto jQuery Chart Web Part for SharePoint.
Create new page and add Virto jQuery Chart Web Part to it.
Sample 1 (Line Chart)
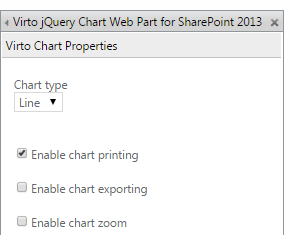
- When Virto jQuery Chart Web Part for SharePoint is added to the SharePoint site page, go to web part settings block.
- Select Line type of diagram.
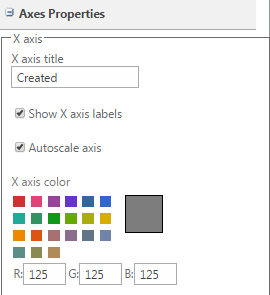
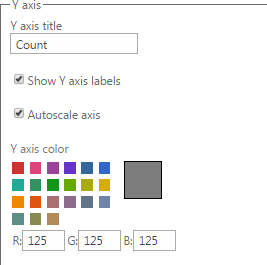
- Define labels for X and Y axes in Axes Properties block.
Then click Create new data source.
For instance, we need to create a data source to get information about workflows with “In Progress” status. Enter “In Progress” in “Data source name” field. Select “SharePoint list” as a data source and “Virto Workflow Monitor Report List” in the dropdown. Then select X axis – “Created” and Y axis – “In Progress”.
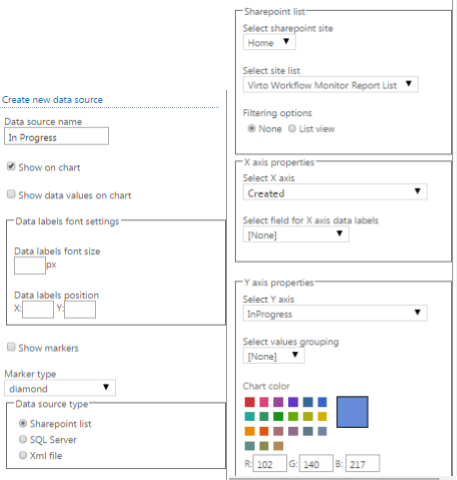
Now select color for displayed line and click “Save”.
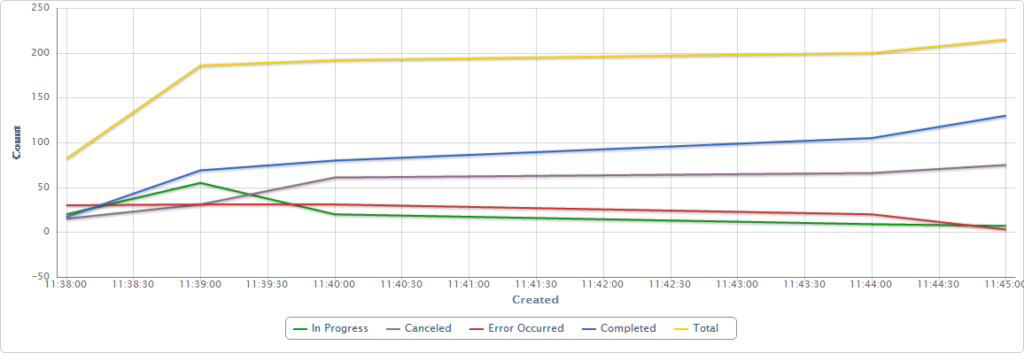
Create data sources for “Completed”, “Canceled”, “Error Occurred” and “Total” the same way.
- Click “OK” to save all the settings. .
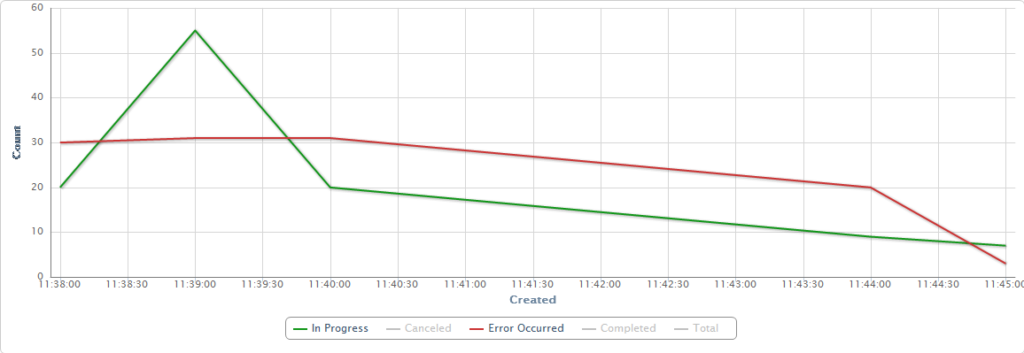
The example of Chart:
Sample 2 (Bar Chart)
You can also create a Bar chart of report information. In order to do that you need to define the settings as described abbe and select bar type of chart.
View:
