Configure Data Sources
When you switch to the edit page mode, two links appear on top of the page:
- Configure Virto Gantt data sources;
- Configure Virto Gantts.
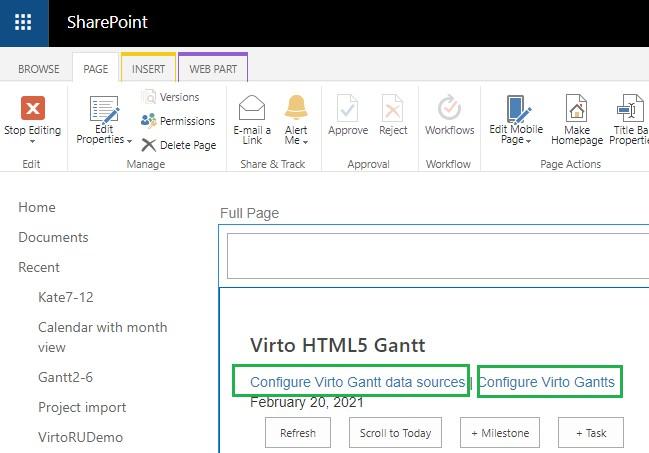
To adjust the Gantt view for a SharePoint list, you firstly need to define data source settings. Click “Configure Virto Gantt data sources”.
The list of already configured data sources will appear. Here you can also add a new data source.
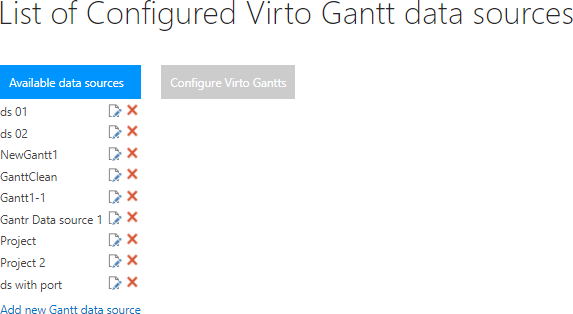
Click on link “Add new Gantt data source” and you will be redirected to thepage to adjusta new data source.
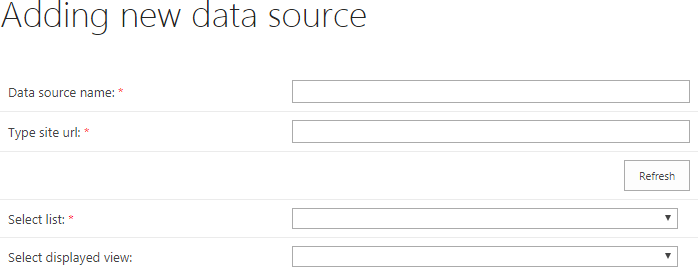
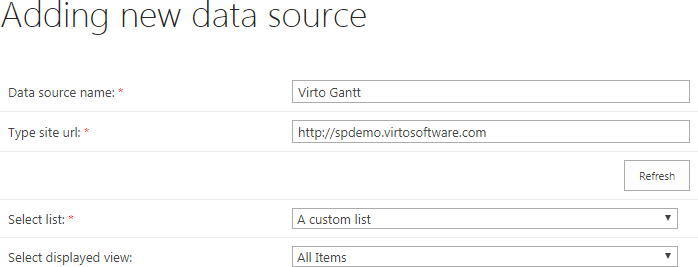
Required fields for data source are marked with “*” symbol.
Add a data source name. Then select site URL or click “Refresh” button to choose current site.
Select list with tasks, which should be displayed in Virto Gantt Chart Web Part. Any list type can be used. If you want to display tasks in a specific list view, select the required view.
Select the field that will be displayed as a task title. Usually, task name is used, but you can assign any other field according to your project demands.
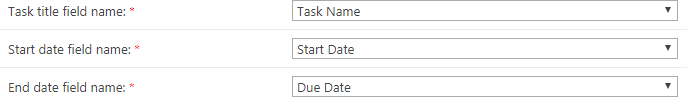
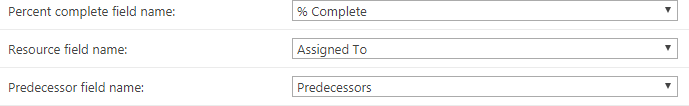
Select fields that contain task start and end dates. If a list contains a field with the task’s percent of completion, you can select the field for the Gantt chart.
Select field with task resources (user or several users who are assigned to the task, usually “Assigned To” field).
Select field with task predecessor(s). Predecessors and successors are connected througharrowsin the Gantt chart.
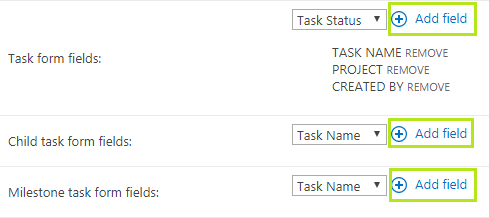
You can define the set of list fields to display on the task form, child task form and milestone. Just use “Add field” button.
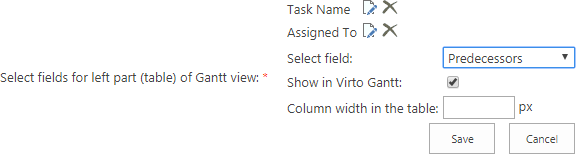
You need to select at least one field, that will be displayed in the left (table) part of the Gantt view. Usually, it is a field with the task name.
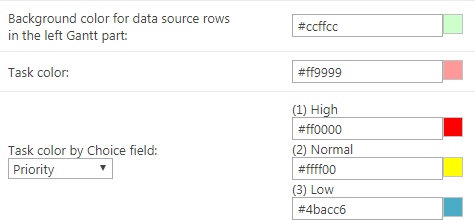
Specify the background colors for source rows and tasks. It is also possible to highlight task statuses or categories by a choice field. For example, you can define custom colors to distinguish task priority statuses.
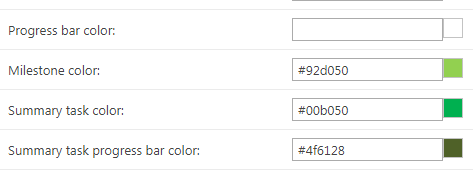
You can also define colors for the progress bar, milestones, summary tasks, and summary task progress bar.
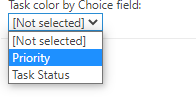
In case there is a choice field in the data source list, you can choose it for color-coding of tasks depending on the value. The dropdown changes according to the selected list and its choice fields.
Click “Save” when you have finished with the fields. The new data source will appear in the list of available ones. Now you can add it as a source