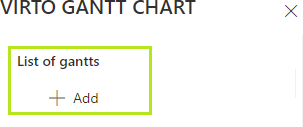
When the list of data sources (or at least one data source) is ready, you can create Gantts. Gantt in the Virto Gantt Chart app is name of a single chart with chosen data sources and applied settings. You can switch between available Gants and analyze your projects on a single SharePoint site page. To configure the Gantt chart switch to the edit page mode and click “Add” under List of gantts.

Step 1. Specify the name for new Gantt.

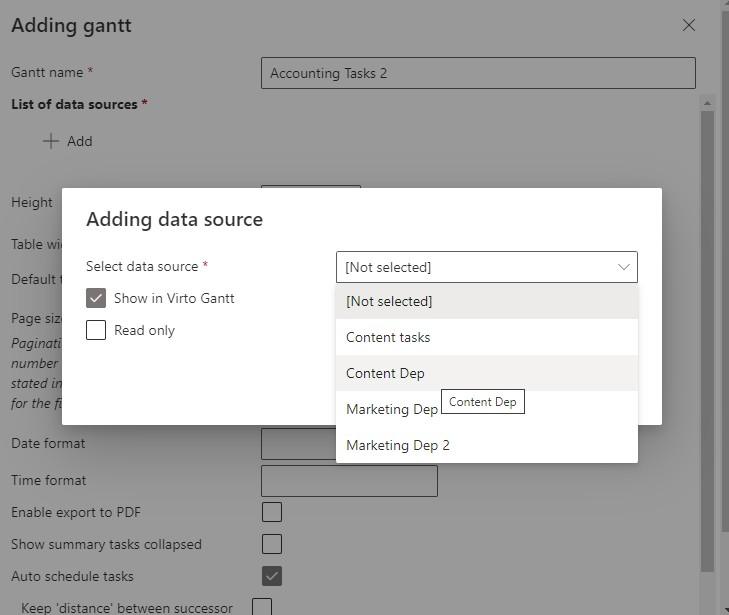
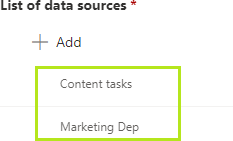
Step 2. Click “Add” under List of data sources and choose at least one data source for the Gantt. Remember to save the added data source.

Note: you can make the data source read-only to disable making changes on it.
You can add multiple data sources to your Gantt chart.

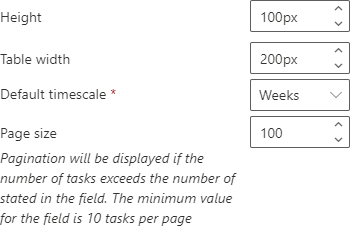
Step 3. Specify height and table width, choose the default timescale and page size.

Step 4. Define the date and time format, if necessary.

Step 5. Tick “Enable export to PDF”, if you would like to allow the option. You also can display the summary
tasks collapsed and enable auto-scheduling tasks.
“Auto-schedule tasks” option will help you to move child tasks accordingly when a summary tasks is rescheduled. If you need to allow doing this only manually, uncheck the option.
Also, pay attention to the option “Keep distance between successor tasks while moving predecessors tasks to the left”. This option is active only when the “Auto-schedule option” is chosen. If you enable it, then the distance between the successor and the predecessor will be the same after rescheduling the predecessor. If you don’t enable this option, a successor will start right after predecessor ends.
Note: if the auto schedule option is enabled, you can set predecessor-successor relations only between non- parent tasks and child tasks. Parent task cannot be a a predecessor or successor in this case.

Remember to save the Gantt.