Available charts: how to create a new chart
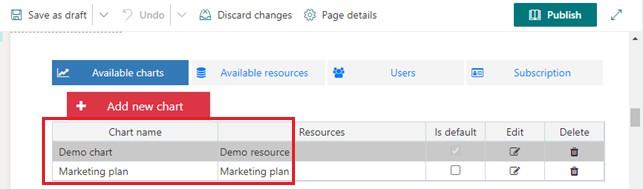
Switch to the “Available charts” tab to add a new chart. If you already have charts tuned on the current SharePoint site, you will see the list of existing charts.
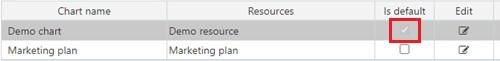
If “Is default” checkbox is chosen, the selected chart will be displayed on app site pages without selected chart ID. It will open after a click on the app icon on the Site Contents page.
Click “Add new chart”.
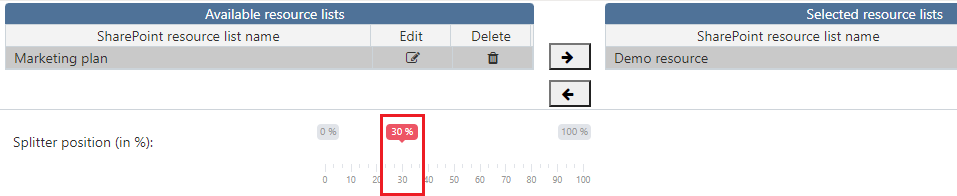
Type the name of new chart. Then add one or more resource lists to be displayed in this chart. Choose the list and then click arrow to add it to the chart.
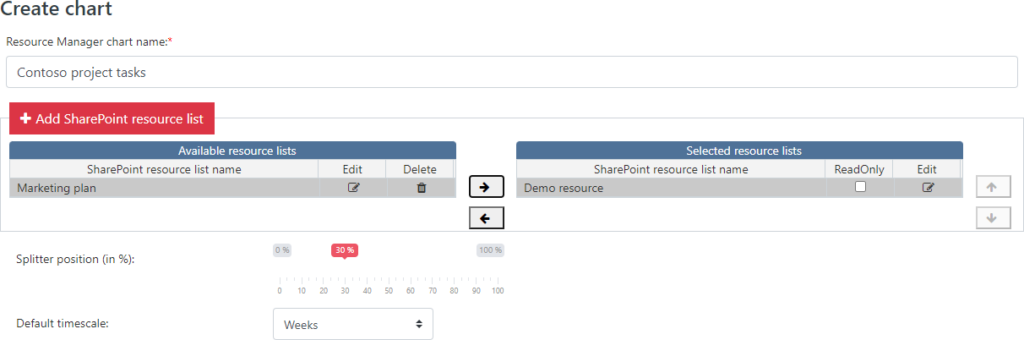
You can also create a new resource. Click “Add SharePoint resource list” and follow the instructions in the “Available resources: how to add a new resource“ section.
Note*: It is impossible to save a chart without any resources included.*
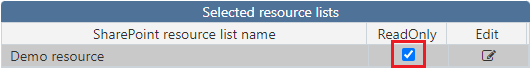
You can edit and delete resources from the chart depending on what data you need to show. It is also possible to apply Read-Only permissionfor the chart. for users. If the chart has “ReadOnly” only permission, the “Add new task” button will be not available for other users.
Then you have to define a default splitter positionfor this chart. The splitter divides the chart into two parts: the table on the left and the diagram on the right. You can always change this proportion for chart view with a drag- and-drop feature.
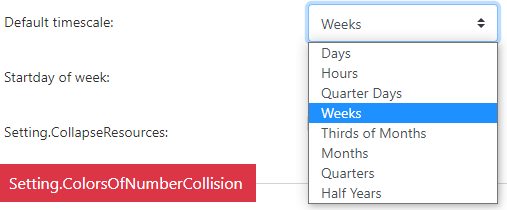
Choose a default timescalefor the chart. The following options are available:
- Days;
- Hours;
- Quarter Days;
- Weeks;
- Thirds of Months
- Months
- Quarters
- Half Years.
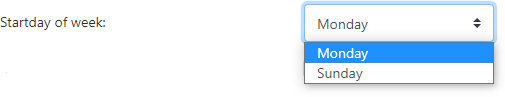
Choose the start day of the week(Sunday or Monday).
If you choose the “Collapse resource lines by default” checkbox, the chart view will contain the resources with collapsed appointment lines to save the space on the page. In this case, just click on the resources to show the full information.
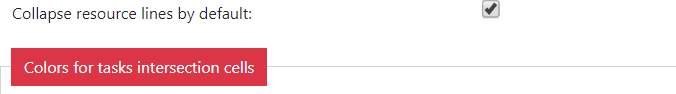
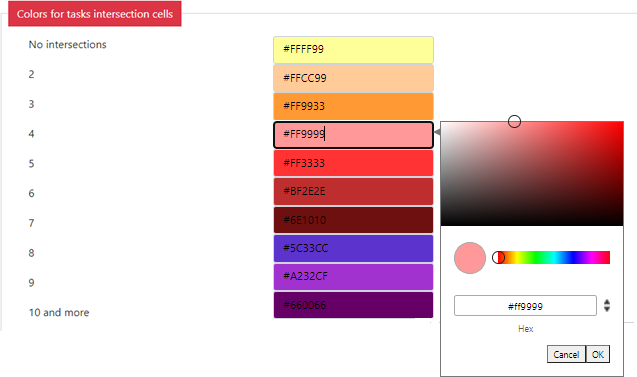
You can specify colors for appointment intersections — a color scheme on the chart timeline, which helps to distinguish the number of tasks overlay. Choose colors for these cells.
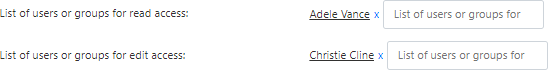
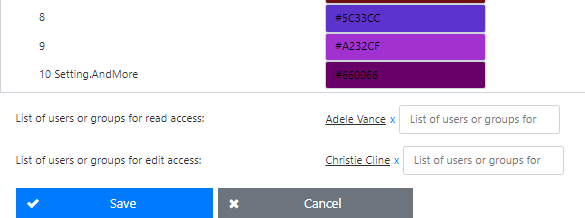
You can set permissionsfor the new chart (Read Only and Edit) and apply them to the chosen users or user groups.
Note*: all users with Edit permission have Read permission as well.*
Click “Save” to complete adding of the new chart.
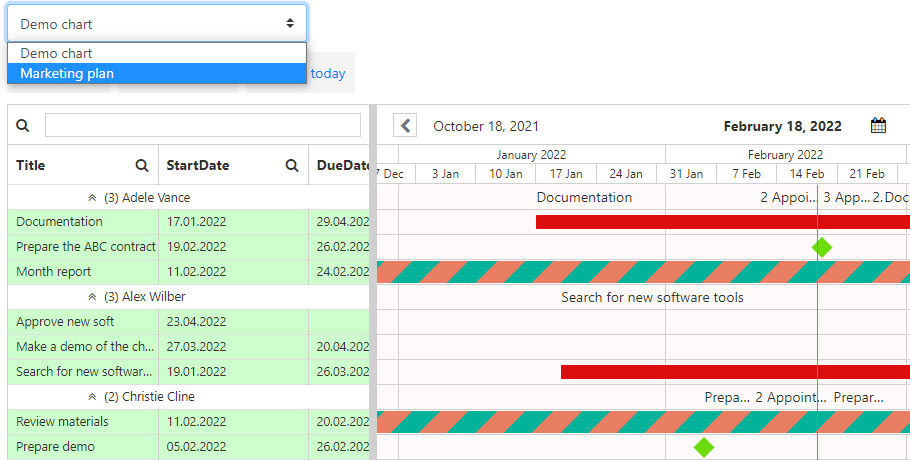
Now you can see the new added chart in the dropdown list. When you have more than one chart in the app, you can switch between them. Just choose the required chart in the dropdown.