Layout of Virto Gantt Chart App
A tuned Gantt chart of the Virto Gantt Chart App consists of a top panel with tools and navigation buttons and a Gantt chart itself.
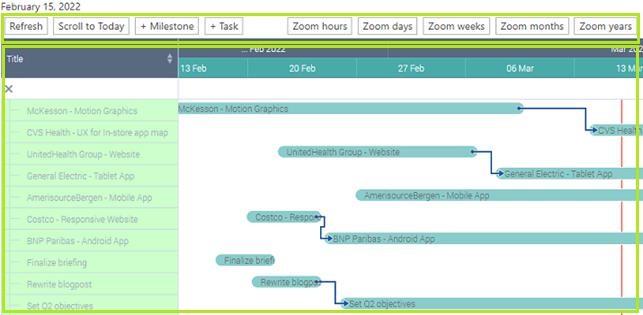
The left part contains the list of tasks from all the chosen data sources. The right part displays the graphical structure of tasks, their duration, percent completion, the order, and parent-child relations. When you scroll tasks in the left part, the right part is scrolled accordingly.
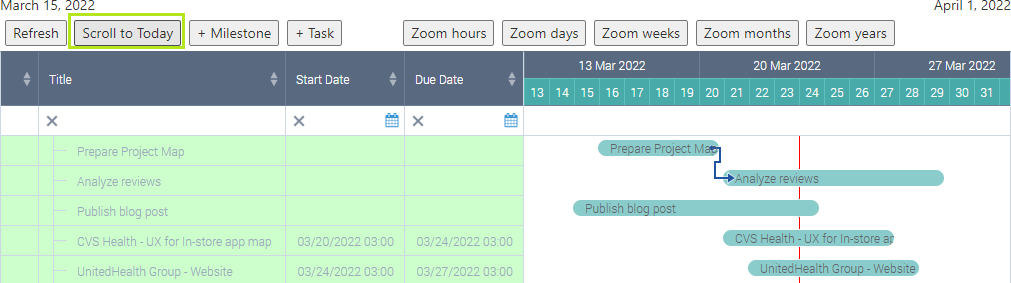
Use “Scroll to Today” button to switch quickly to the current day within the chosen timescale.
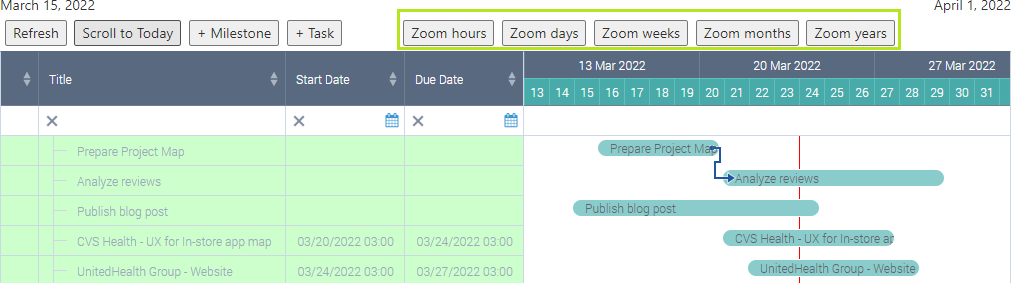
To change the timescale, use one of the following buttons: “Zoom hours”, “Zoom days”, “Zoom weeks”, “Zoom years”. Choose the appropriate one depending on tasks’ duration. Remember that you can choose a default timescale in the Gantt settings.