Configure Data Sources
Before you adjust Gantt view, configure data sources. You may use a single SharePoint list as a data source or choose multiple lists to display in a single Gantt chart.
Note*: SharePoint Task list is the best option of a data source for your future Gantt chart. However, you can use custom SharePoint list too. Just make sure it contains fields you can use for proper work of the Gantt chart (start/end date, lookup field for predecessor, and etc.). The data source list also should contain the Parent ID field.*
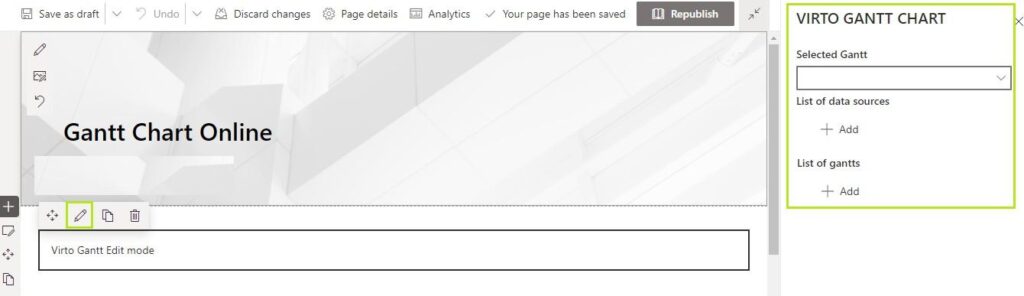
In the Edit page mode click “Edit web part”. The Virto Gantt Chart app settings will appear on the right part of the page.
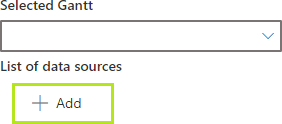
Click “Add” under the List of data sources.
Now fill in the fields as described in the steps below to add the new data source to the app.
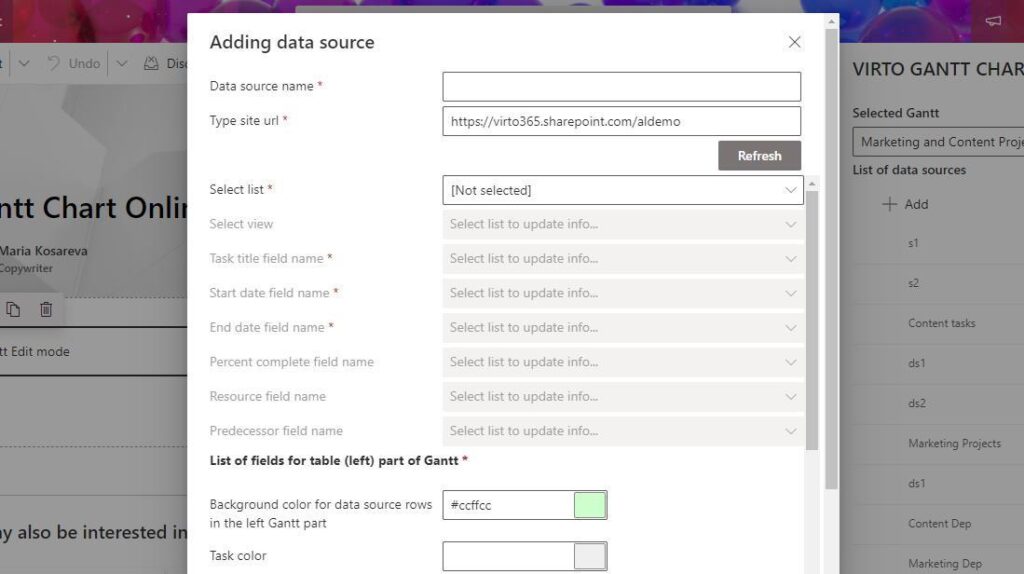
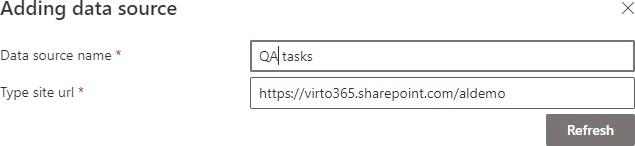
Step 1. Specify the name of the new data source and type the site URL where the list you’re going to add belongs to (the URL of the current site appears automatically, but you can change it).
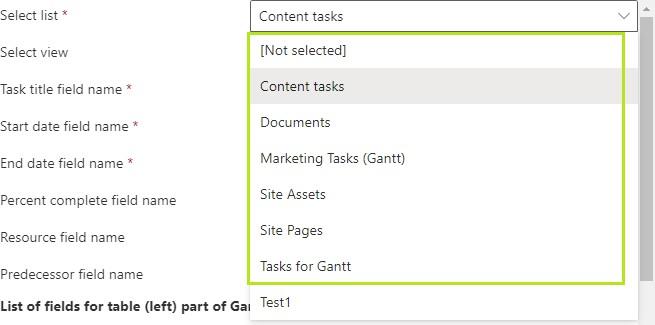
Step 2. Choose a SharePoint list.
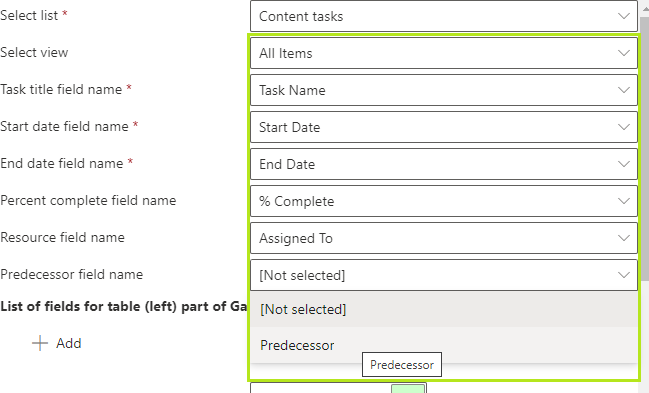
Step 3. Now chose the fields from your list to show in the Gantt chart. Make sure you have chosen all the required fields.
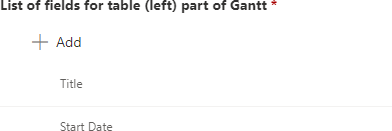
Step 4. Decide which fields you would like to show in the table part of the Gantt chart.
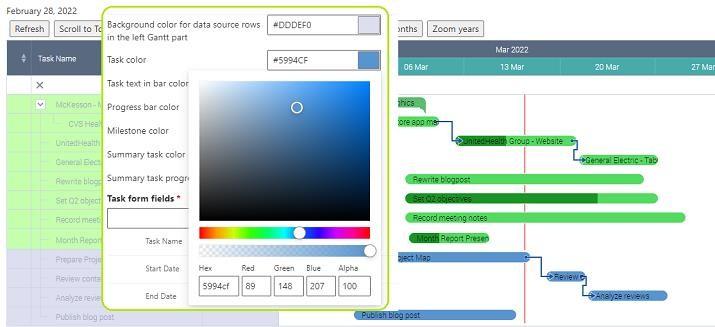
Step 5. Color-code the tasks. You can specify colors for data source rows on the left part of the Gantt, tasks, text in bar, milestone, summary task and task progress bar.
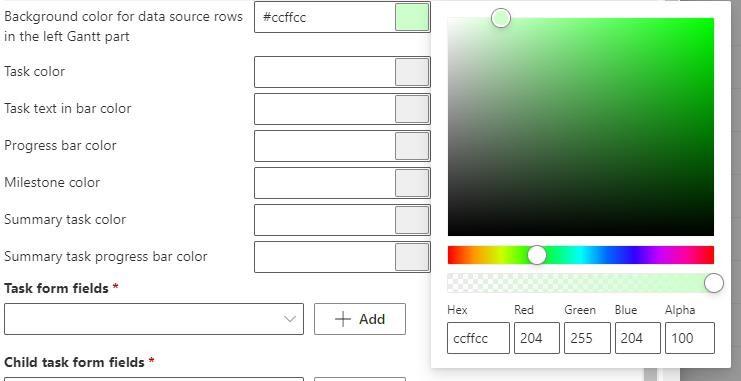
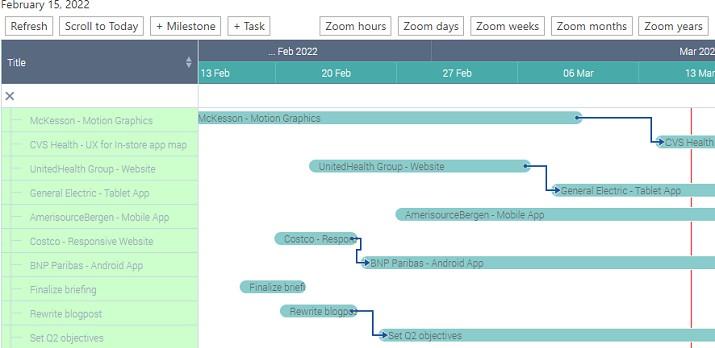
Color-coded Gantt chart may look completely different to default colors. Use this functionality to distinguish multiple data sources and for other purposes. Compare classic and color-coded Gantt charts below.
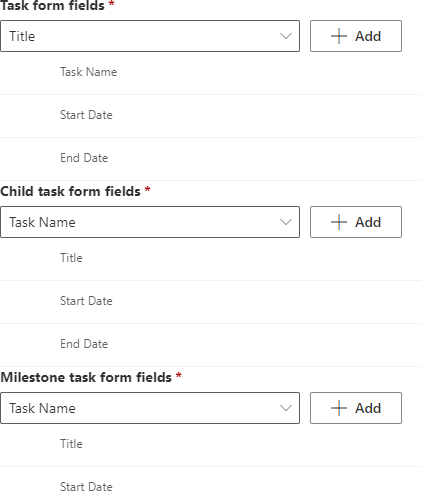
Step 6. Decide which fields you need to display in the task view form.
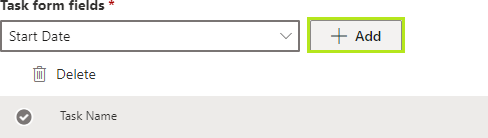
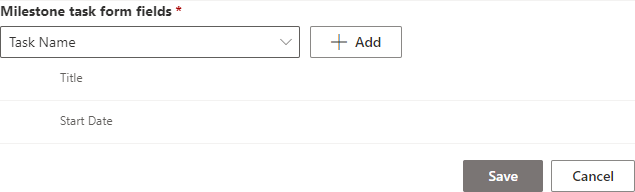
You also can define fields to display in child task and milestone forms.
Remember to save the new data source.
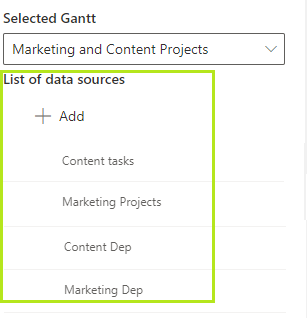
This way you can add as many data sources as you need and use them for creating Gantt charts.