Charts
The Virto Kanban Board App supports making reports for your boards in a chart view. To open the chart view, click the charts icon in the upper-right corner.
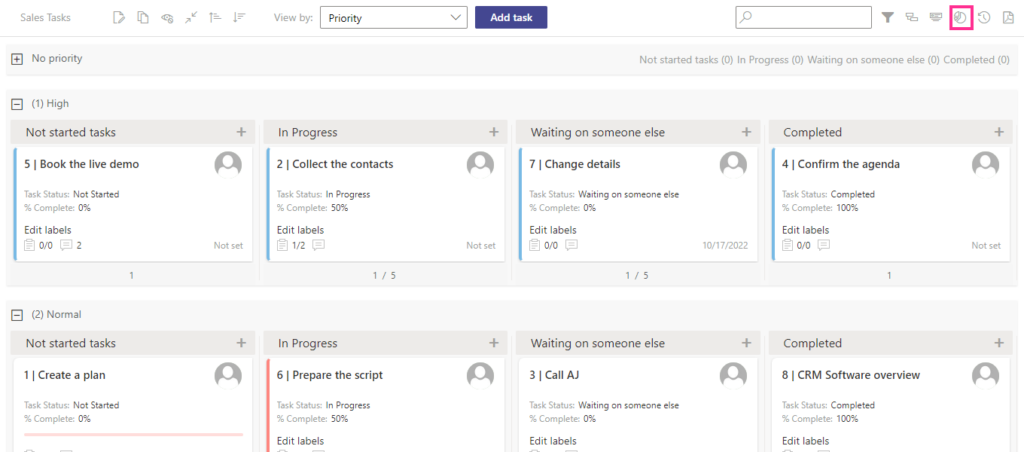
Here you can see task statistics displayed in five graphs: “Status," “Assigned to," “Completion," “Burndown," and “Lead Time.”
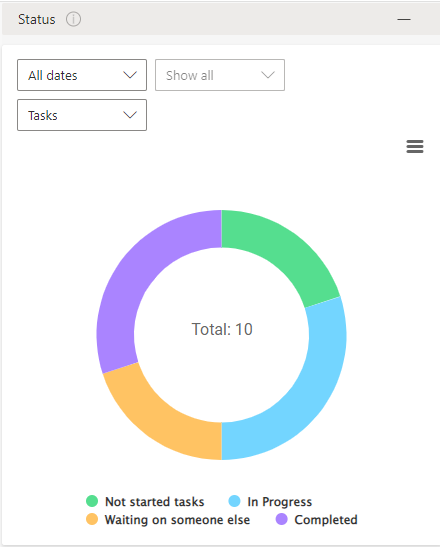
Status chart#
This pie chart shows tasks grouped by status. In the drop-down menu, select the field you need to analyze, such as the due date, the time period to analyze, and the unit as number of tasks, percentage, or budget. You can save this chart as an image.
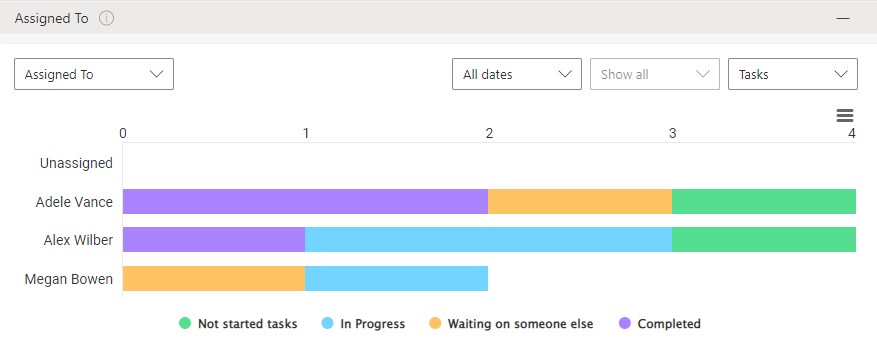
Assigned To chart#
This graph shows tasks grouped by assignees. It works similarly to the “Status” chart. For example, you can display the board members who modified tasks over the last month.
Completion chart#
Use the “Completion” chart to see tasks completed on time or late. Since the data displayed in the chart comes from the SharePoint source list, completed tasks may also be in other columns, such as “Deferred” or “Need someone else.” You can add these to your report as well.
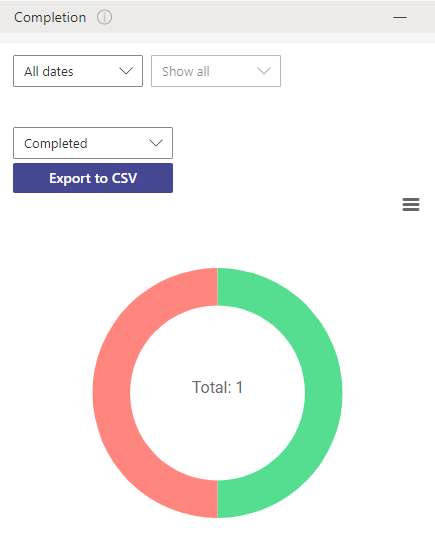
The “Completion” chart shows only tasks with a due date set. If a task has no due date, it does not appear here on this chart.
You can export the chart to a CSV file to see the “Completion” report in detail. In this format, you can sort the tasks and, for instance, see the team members responsible for the overdue tasks.
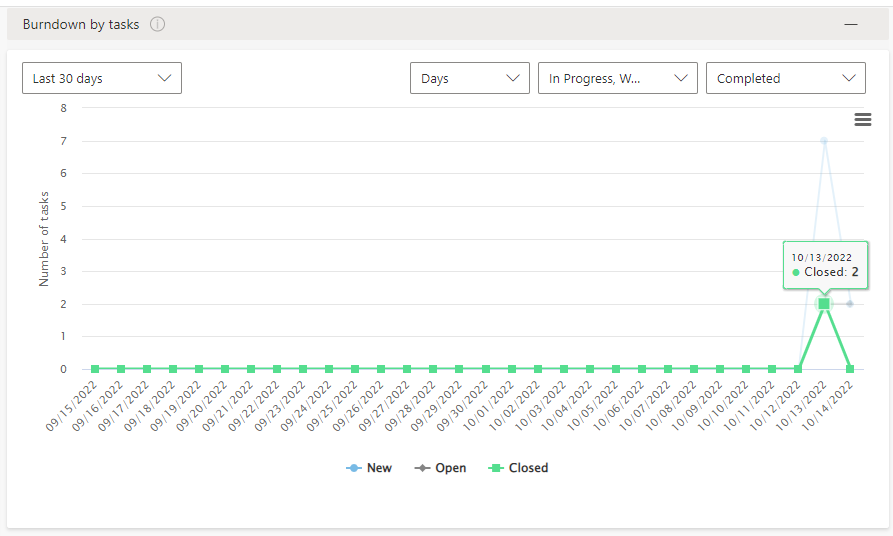
Burndown chart#
Use the “Burndown by tasks” chart to display the work remaining. The graph is created automatically according to the tasks remaining on the board. Simply choose the desired period to analyze the efficiency.
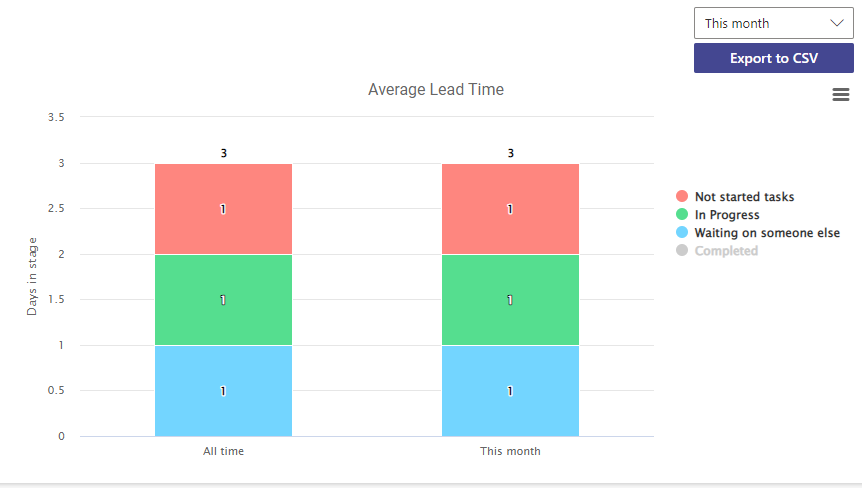
Lead time chart#
The lead time chart measures the total time elapsed from the creation of work items to their completion.