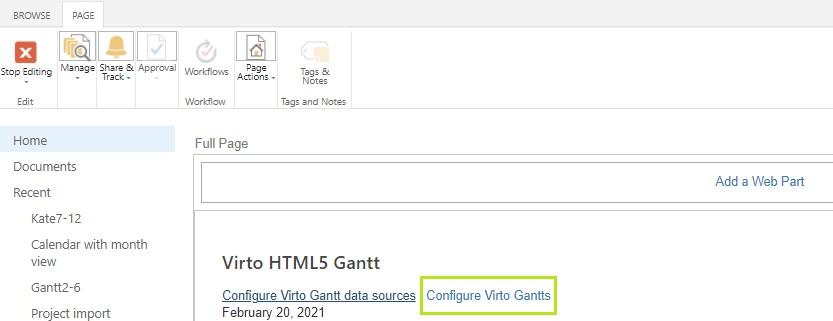
To configure the Gantt chart switch to the edit page mode and click “Configure Virto Gantts”.

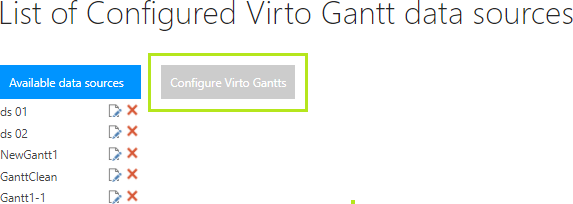
Or use the same button on the page with data source list.

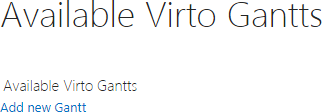
On the page with available Gantts you can edit/delete existing configured Gantts or add a new Gantt.

Click “Add new Gantt” to add a new Gantt chart.

Required fields are marked with “*” symbol.
Type the Gantt name. Then click “Add new source” button to add at least one data source to the Gantt.

Every data source has its own options. You can tick off the checkbox “Show in Virto SharePoint Gantt“. This data source will be unavailable for displaying (will be saved without publishing). Also, you can add data source with read only permission, i.e. user will not be able to create/modify tasks in the Gantt Chart Web Part for the data source.

Click “Save” button. You can add other data sources to this Gantt as well.
Then set height of Gantt in pixels if you want to limit size of Virto Gantt Chart Web Part displayed on site. Default height value is 800px, default width proportion is 100%.

Choose the default time scale (for example, days, weeks, months, and year).

Tick the checkbox “Use SharePoint form for editing task” to display default SharePoint form for task editing. You can also allow opening the SP form as a full-size page.

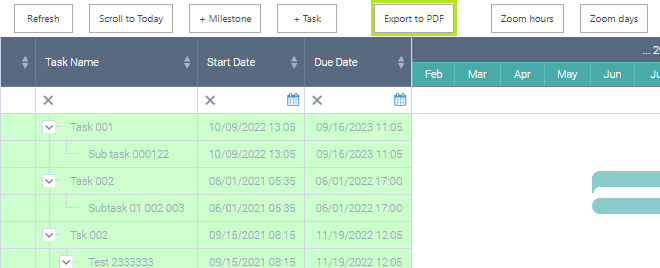
The “Enable export to PDF” feature allows you to save your Gantt chart as PDF.

This option adds the button on the Gantt header; the PDF file with current Gantt table view will be downloaded automatically after you click this button.

The next option allows you to show summary tasks collapsed by default.
The Auto schedule feature helps to manage successor and predecessor tasks. It protects from cases when a successor task starts before the predecessor.

Click “Save” to complete the new Gantt adding. The same way you can edit an existing Gantt.